In our most recent market strategy meeting, we reviewed several historical financial and stock market crises in an attempt to find commonalities that might offer useful perspective on the current investment landscape. While no brief commentary could adequately depict the complex series of events leading to any crisis, there are themes, generally involving human behavior, that tend to recur. We are not, of course, calling for an imminent market correction. As our readers know, we believe that trying to predict major market moves is an exercise in futility (see our Q1 2021 commentary If You Had a Crystal Ball). Nevertheless, given the current environment of elevated equity valuations, interest rates near all-time lows, and debt-fueled liquidity, it is worth examining whether typical signs of a bubble currently exist, and indeed is our responsibility to our clients. Please do not interpret this note as a prediction of doom: as we have often noted, even obvious crisis-signaling risks can build for years before their impact is manifested in markets. Rather, this is intended as an assessment of potential risks, which we weigh against opportunities as we construct and manage portfolios.
The S&P 500 ended the third quarter 4% below its recent record high, having posted an impressive 15.9% return for the year. Yet again, in 2021 the broad US market has significantly outperformed foreign stock markets which in aggregate returned 6.2%. Foreign markets were dragged down by emerging market stocks (which lost 1.1%), which in turn were weighed down by problems in China, including government pressure on the technology sector, and the likely bankruptcy of the largest Chinese real estate company. The recent increase in Chinese military incursions into the Taiwanese air defense zone further highlights China-related risk. Other concerns that have recently weighed on investor sentiment have been increases in COVID variant infections and general price inflation (both of which remain high, albeit below recent peaks). Economic and company earnings growth remain strong in both the US and abroad, supporting the bullish case, though the recent deceleration of both offers ammunition to the bearish camp.
Graph 1 shows a long-term history of the US stock market, highlighting a number of severe corrections. While the upward trajectory demonstrates that it’s generally a bad idea to be uninvested in stocks, it also shows that it can take many years for the market to recoup losses after a major correction. We believe it’s worthwhile to examine past crises to identify commonalities, in the hope of noting when similar conditions exist. If we can do that successfully, then we might improve our chances of avoiding excessive market exposure before a major correction, even if we can’t predict its timing with precision.
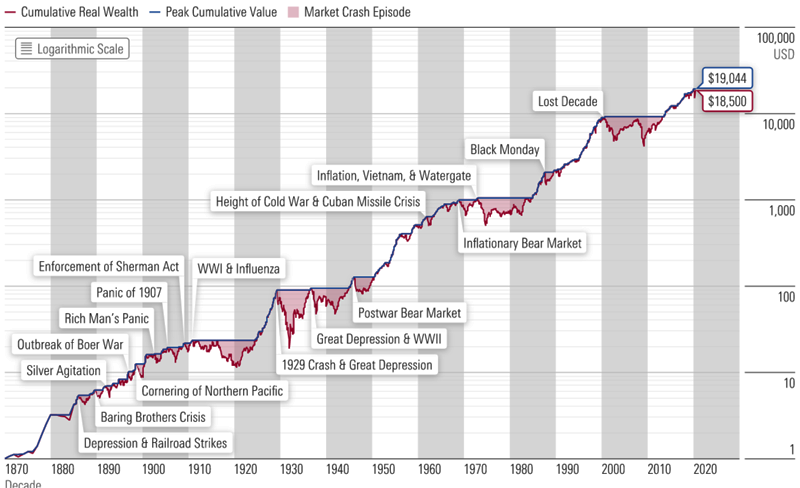
Graph 1, source: Morningstar, Kaplan, Ibbotson, Yale/Shiller
A study of many financial crises over the past 400 years has led us to conclude that there are three common elements that often occur in pre-crisis periods. Of these three conditions, at least one has always been present, and often two or three:
- An environment of speculation, during which investors jump on a powerful upward market trend en masse, paying prices well in excess of historical averages (“this time is different!”).
- Excess leverage in the system. Investors borrow heavily to invest, and then suffer severe losses as their financing evaporates and they are forced to sell into a market with few or no buyers.
- Foolish government policy, which generally introduces perverse incentives, and magnifies the damage.
Let’s now touch on a few crises that occurred over the fairly recent past to see if we can draw parallels to the current market environment. As previously noted, a paper this short cannot offer a thorough summary of any past crisis; rather the intent is to highlight major themes present at the time, with an eye to drawing parallels between periods…to the extent they exist.
The Panic of 1907 was triggered by an unsuccessful speculative effort to corner the copper market, which led a general panic and runs on many New York financial institutions, particularly trust banks. Trust banks were lightly regulated financial institutions that lent heavily to stock market investors, but only had to hold a fraction of cash against deposits compared to that required of state and nationally regulated banks. The excessive leverage at the trust banks called their solvency into question and contributed to the runs, amid a stock market collapse that saw the Dow Jones Industrial Average (DJIA) eventually decline 49%. In a scenario reminiscent of today, the panic had been preceded by a period of easy money, with low interest rates and the US government buying back its own debt. Though stock valuations had not been excessive going into the crisis, there were at least two clear hallmarks of general investor panics: unsound regulatory policies in the form of low trust company capital requirements, and easy money, both of which led to excessive financial leverage. Ultimately, this collapse led to the formation of the Federal Reserve Bank, designed to serve as the financial system’s lender of last resort.
Graphs 2 and 3 show short term financing rates in 1907 and 2008, and illustrate the eerie similarities between the two periods, both of which saw the panic liquidation of investments that could only be financed at exorbitant rates, or not at all.
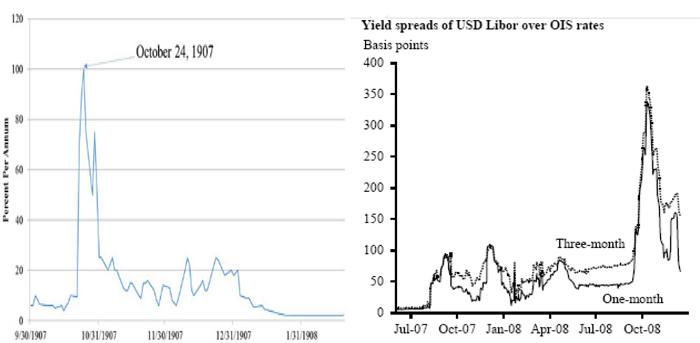
Graph 2 (left), source: GS, BBG (left); Graph 3 (right), source: FRBSF
The Great Depression of 1929-1939 was the period that saw the greatest economic and stock market decline in modern history – unemployment in the US hit 25%, and the stock market ultimately declined 89%. Whereas there is debate about the causes of theGreat Depression, two things are inarguable: it was preceded by a boom involving financial speculation (though stocks were far less expensive relative to earnings than they are now!), and the Depression was greatly exacerbated by ill-advised government policy by many countries in the form of protective tariffs (begun by the US). Ultimately, these tariffs led to a collapse in global trade, which prolonged and deepened the Depression.
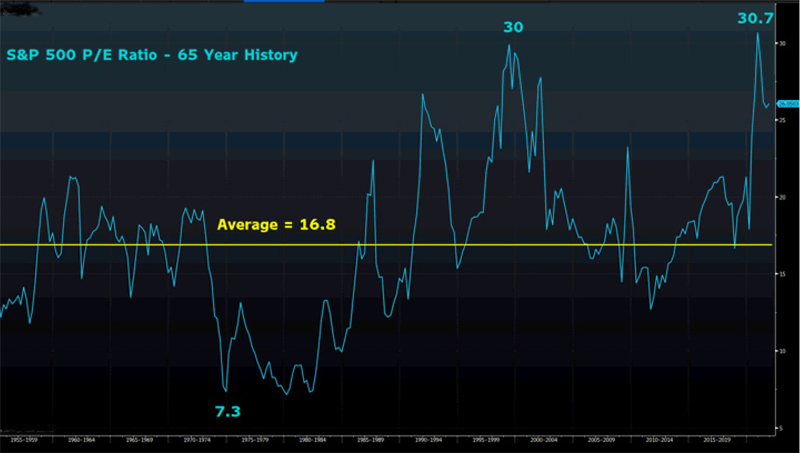
Graph 4, source: Bloomberg
The Dot-Com Crash of 2000-2002 was caused by high stock valuations. In contrast to the other market collapses mentioned, this one was characterized primarily by only one of the common elements: speculative excess leading to high stock valuations. With the emergence of the Internet, investors engaged in one of the greatest examples of herd behavior in market history, paying extreme prices for companies with minimal or no earnings, betting exclusively on future growth. The S&P 500 hit a P/E ratio of 30x, which until this year was a record (Graph 4; the horizontal yellow line depicts the longterm average P/E). While the stock market ultimately declined 49%, the lack of systemic leverage limited damage to the broad economy, resulting in a relatively shallow recession and no threat to the financial system.
The Great Financial Crisis of 2008/2009 was one defined by excessive financial system leverage, as well as harmful regulatory policies. Interestingly, while there was significant speculation in debt markets, stocks were not particularly expensive going into the crisis. Despite reasonable stock valuations, there were several factors that came together to create a perfect storm. Echoing 1907, systemic debt hit extreme levels driven by the emergence of lightly regulated, highly leveraged “shadow banks”, as well as Wall Street derivative products with significant embedded leverage. Additionally, misguided regulatory policies abounded. While interest rates had probably been kept low for too long after the dot-com crash, the major culprit was US government housing policy, which effectively subsidized mortgage financing costs for high-risk borrowers in a futile attempt to increase home ownership by low-income households. Ultimately, the proliferation of debt-funded low-quality investments led to the forced selling of risky assets, a 57% stock market decline, a housing market implosion, and a near collapse of the global banking system.
The COVID Collapse of 2020 is an example of an asteroid: a risk that cannot be foreseen, which as a result has outsized market impact because its occurrence was not reflected in market prices. Although the catalyst for the crisis was unforeseeable, the environment then (as now) was one characterized by extraordinarily easy monetary policy, which created distortions leading to historically high stock and bond prices. The stock market decline (35%) and the shutdown’s economic collapse were the swiftest in history, prompting excessive bearishness that led investors to extrapolate trends and envision an Armageddon sort of future. In retrospect, the collapse represented a superb buying opportunity, as a re-opening economy and trillions of dollars of monetary and fiscal stimulus propelled stocks to record highs.
Yet, while the pace of company earnings growth has recently reduced price-earnings ratios, the market P/E ratio nevertheless remains close to all-time highs. And though household and corporate debt levels are not at alarming levels, US government debt is at a record high (Graph 5). Insidiously, one branch of the government (the Federal Reserve) is buying the debt of another branch (US Treasury) at depressed interest rates. These depressed rates make low-risk fixed income assets (such as high quality bonds) unattractive, and the large amounts of money the Fed is pumping into the economy create powerful incentives to buy stocks, which are contributing to what may be a historic market bubble. Once interest rates rise materially, or the economy and earnings growth slow, we have a recipe for a significant market correction.
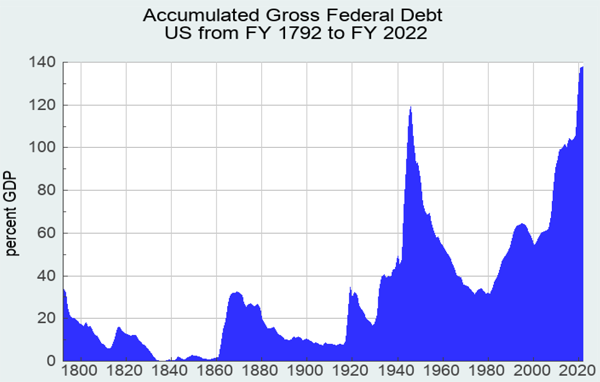
Graph 5, source: USgovernmentspending.com
So What to Do?
It is important to recognize that identifying risks (however glaring) is an entirely different matter than accurately predicting the timing of a crisis, or even of a market correction. Trends, including excessive stock valuations, can remain in place for years, and even if a bearish view is ultimately vindicated, such vindication can be very costly. In fact, for the last eight years stocks have been more expensive than historical averages, and the policies described have largely been in place over that time. Yet US stocks have tripled in value over that period, a painful result to have missed.
We recognize both the obvious current risks, many of which are consistent with those preceding past crises. At the same time, we recognize that the strong current economy buoyed by plentiful, cheap financing could easily extend the trend for months (or even years). We are balancing these competing risks by maintaining a modest underweight to stocks in our portfolios, and short maturities in our bond holdings to mitigate the risk of rising interest rates.
Just as there is no crystal ball to predict market direction, there is no strategy to consistently and accurately reduce risk ahead of market declines. As we often advise, the best risk portfolio management technique is to simply not have too much risk for one’s personal situation before a crisis hits.
Please feel free to contact me or another SFA team member to discuss further, and to review the appropriateness of your portfolio’s risk for your current situation.
 To Top