After a sharp two month rally ended in August, the US stock market resumed its downward trajectory, and now, down 23.9% for the year, is firmly ensconced in bear market territory. Both stock and bond markets have been repricing risk as investors try to assess the impact of the Federal Reserve’s belated tightening of monetary policy to combat inflation.
After holding policy rates close to zero as CPI inflation rose to over 8%, the Fed has now taken a very aggressive stance, raising interest rates by 3% over a 6 month period (and forecasting significant further hikes). This pronounced hawkishness has led to growing fears that the Fed, late to the inflation fight, is now tightening policy excessively, which could lead to a significant economic contraction. Indeed, market prices of Treasury Inflation Protected Securities (TIPS) show that investors expect inflation to swiftly decline to the 2.25%-2.5% range and remain there for over ten years.
Inflation and the magnitude of the Fed’s tightening have also caused high quality bond prices to plummet; US high grade bonds, which historically have served as a hedge against stock price declines, have lost 14.1% this year and are on track for their worst year ever. High yield bonds and foreign stocks have also experienced double-digit declines, cryptocurrencies have done worse (Bitcoin has declined 56%), and even gold (often an effective hedge against stock market losses) is down for the year. Holders of cash have lost significant purchasing power, given current high inflation rates. In short, there has been nowhere to hide as investors assess where asset values should settle.
Although the labor market remains strong, the financial market headwinds have impacted the real economy, which slid into recession (defined as two consecutive quarters of negative GDP growth) this year. The real estate market has been hit hard, with home sales stalling as higher prices and higher mortgage rates have significantly lessened affordability. Graph 1 shows that mortgage rates have more than doubled this year, contributing to housing affordability dropping to levels not seen since before the Great Financial Crisis of 2008/2009.
Graph 1
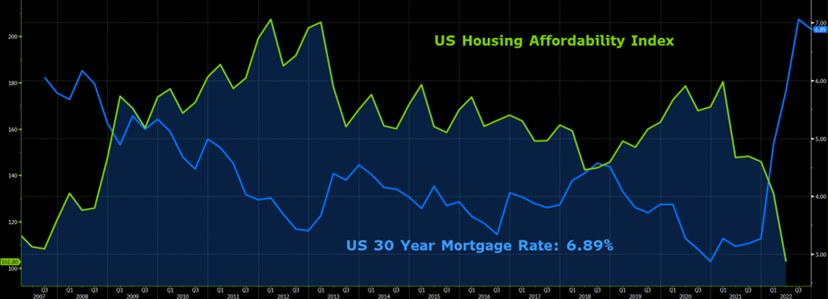
Source: BBG
So is all doom and gloom? Not necessarily. While material market corrections are quite painful, they occur with some frequency, and are an unavoidable part of investing and reaping the returns thereof. Especially during times like these, it is critically important to bear two important points in mind. First, it’s impossible to predict market highs and lows with any accuracy. Therefore, no strategy to get in before the market goes up and to exit before the market declines is likely to work, and certainly not over the long term. The notion that this is possible is a foolish illusion. The correct strategy is for investors to always have an appropriate amount of portfolio risk, and to stick with the plan throughout market cycles.
Second, down markets create opportunities to add assets to portfolios at cheaper prices, thereby laying the foundation for favorable future returns. It’s important to maintain the mentality of viewing price corrections as opportunities to buy cheaper assets, not as triggers to panic and sell.
Graph 2 shows the 51 best days of the broad US stock market over the last 42 years, as well as the largest down days (when the market sank by 4% or more). Note that both the good and bad days are tightly clustered together, a fact which highlights the futility of trying to capture the big up days while avoiding the days of large losses. That these big up and down days are clustered together reflects that investors are repricing risk, and trying to decide where prices should settle. Note also that these periods of extreme volatility tend to occur near market bottoms, before sustained long-term rallies begin. While the fact that we are currently experiencing extreme volatility does not necessarily indicate that we are at a market bottom, it is consistent with the type of historical volatility that precedes market troughs, which are then often followed by sustained rallies.
Graph 2
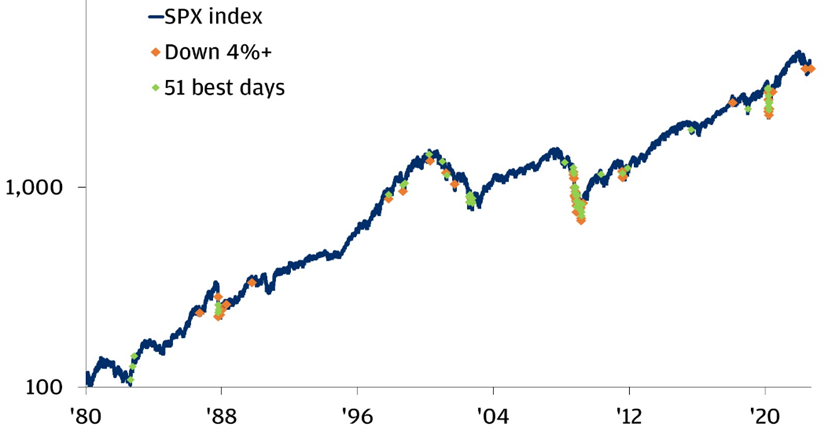
Source: JPM, BBG
Consistent with the discipline of adding portfolio risk as asset prices decline, we recently added fixed rate high yield bonds to our portfolios. Graph 3 shows that the correction in the high yield bond market has caused the sector’s yield to rise from an anemic 3.53% in the summer of 2021, to 9.88% today. High yield bond issuer defaults, which have been extremely low by historical standards, are likely to rise, perhaps significantly, as the economy slows. Nevertheless, we believe that current yields adequately compensate investors for the risk of rising defaults. Historically, investors who have bought at these yields have enjoyed positive returns over the subsequent 12-18 month timeframe.
Graph 3
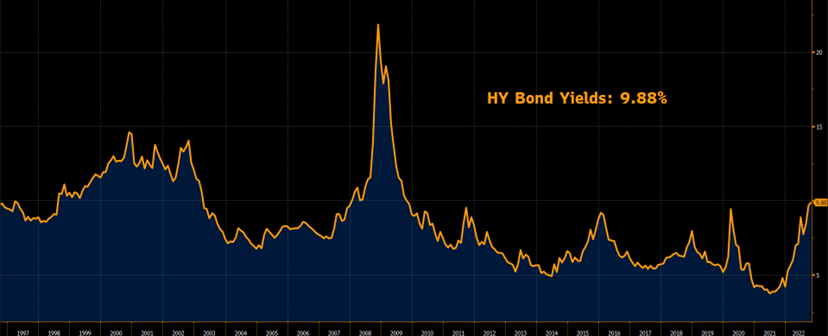
Source: BBG
Graph 4 compares the average yield on short maturity investment grade corporate bonds to that on high dividend US stocks. Years of near 0% interest rate policy by the Federal Reserve artificially suppressed the yield on these high grade bonds, rendering the sector unattractive (a point we have made for years). With higher interest rates, the sector has become significantly more attractive, and offers a more compelling, lower risk alternative to stocks. As a result, we need to reassess our allocations to this sector, as repricing has created a new potential opportunity.
Although it’s difficult to assess whether equities have yet corrected enough to become attractive to add, certainly the correction has taken stock valuations from extremely expensive levels to something nearer historical averages. Given that, we are also contemplating where we might add exposure to stocks, perhaps eliminating or reducing our current underweight position relative to our neutral strategic position.
Graph 4
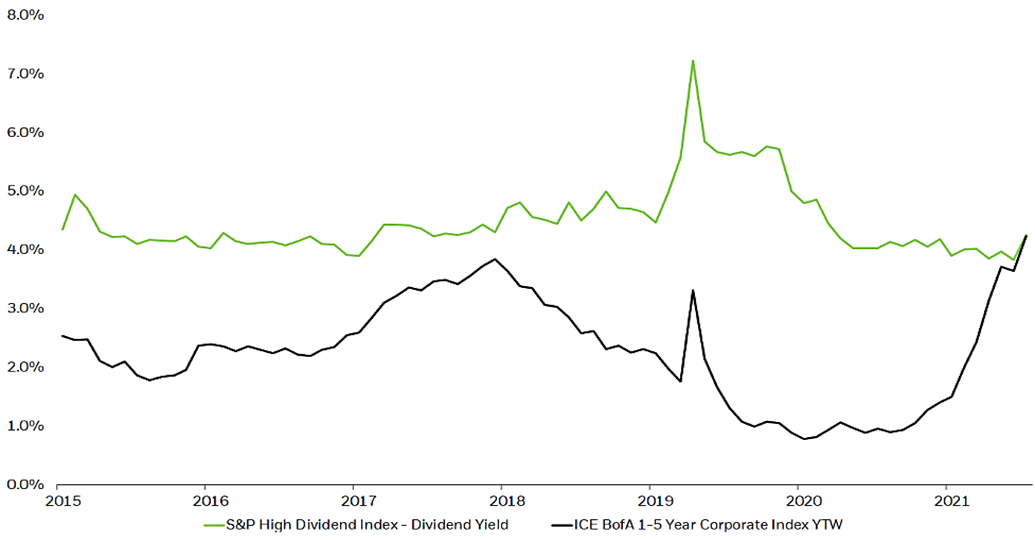
Source: Blackrock, BBG
In the future, many books will be written about the folly of Federal Reserve monetary policy over the past 15 years, and the distortions, bubbles, and subsequent corrections it created. Meanwhile, we remain aware that neither good or bad markets continue in perpetuity, and that major corrections create major opportunities, for those with the wherewithal and discipline to capitalize on them.
Thank you for your trust, and please don’t hesitate to contact a SFA team member with questions, or to review the appropriateness of your current investment allocation.
The information contained within this letter is strictly for information purposes and should in no way be construed as investment advice or recommendations. Investment recommendations are made only to clients of Santa Fe Advisors, LLC on an individual basis. The views expressed in this document are those of Santa Fe Advisors as of the date of this letter. Our views are subject to change at any time based upon market or other conditions and Santa Fe Advisors has no responsibility to update such views. This material is being furnished on a confidential basis, is not intended for public use or distribution, and is not to be reproduced or distributed to others without the prior consent of Santa Fe Advisors.
 To Top