The Fed Transitions as Inflation Does Not
Minutes from the March FOMC meeting and comments from several Fed Governors reveal a Federal Reserve Bank that is rapidly transitioning to a much more hawkish monetary policy stance, as hopes fade that inflation would be transitory. In our July 2021 commentary (“Inflated Worries?”), we discussed whether price pressures resulting from COVID-related supply chain bottlenecks would be short-lived (as your author and the Fed suspected). So far they have not: US April consumer prices were 8.5% higher than a year before – the largest increase in over 40 years. The Fed’s policy reversal follows criticism that they might be well behind the inflation curve, having kept short-term rates at zero for several quarters as inflation rose. On March 16, the Fed raised the Fed Funds rate by .25%, a modest move likely tempered by fears that the Russia/Ukraine war might cause a global recession.
Despite the limited nature of the Fed’s recent move, market expectations for future policy rate increases have soared. Graph 1 shows that futures markets expect the Fed Funds rate to be 2.5% by the end of 2022, a significant increase from the .75% expectation at the beginning of the year. (The Fed revised its year-end midpoint estimate for the policy rate from .75% to 1.75%.)
Graph 1
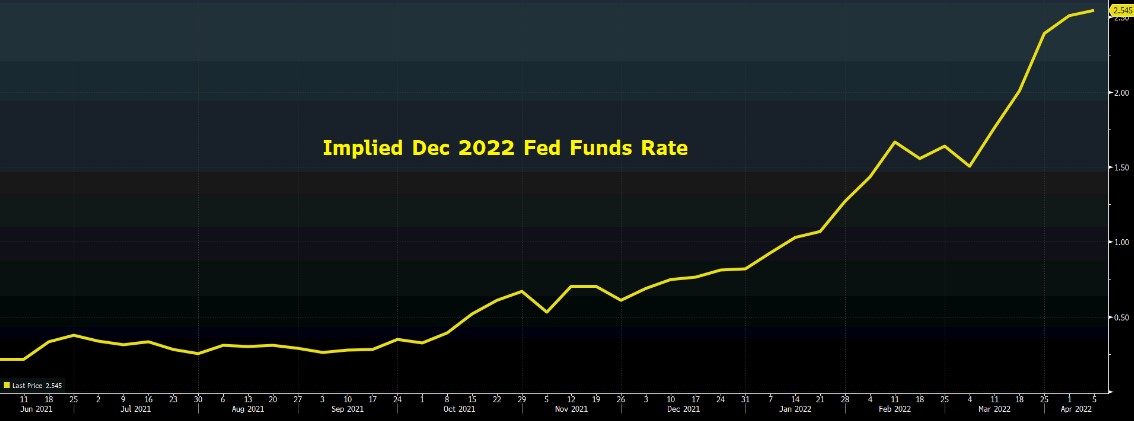 Source: BBG
The Fed finds itself in a conundrum. If it raises rates too quickly, it risks a recession (the Fed also recently revised its 2022 GDP forecast significantly lower) and much higher Treasury financing costs (a big deal given our fiscal deficits). However, if it continues to keep rates too low, inflation could spiral out of control, leading to even more aggressive tightening in the future, and perhaps a more severe recession. While the change in policy direction seems clear, the Fed might already be too late to stuff the inflation genie back in the bottle.
Market Implications
In past commentaries and strategy meetings, we have often reviewed the historical relationship between inflation and stocks. One theme emerges: stocks generally do well in environments of moderate, and even high and rising inflation. Graph 2 illustrates that stocks usually do well as interest rates (an inflation proxy) rise, with this correlation reversing only at rates much higher than today’s levels. It is only in environments of deflation and hyper-inflation (loosely defined as 8-10% or higher) that stocks tend to do poorly. Among the reasons for stocks coexisting well with inflation are that such environments tend to be coincident with strong economic growth, and corresponding increases in company pricing power and therefore profits.
Graph 2
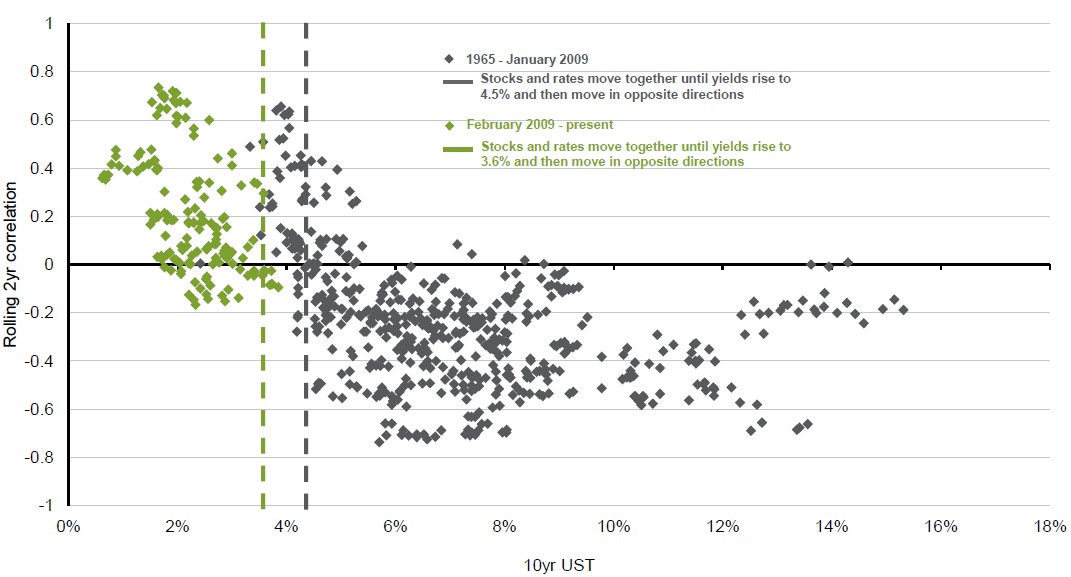
Source: JPM, FactSet
The correlation between inflation and high quality bonds is far more direct: rising inflation leads to increases in interest rates (both short-term policy rates set by the Fed, and long-term market-driven rates), which cause price losses in bonds. Importantly, the longer a bond’s maturity (or duration), the larger the loss for a given increase in interest rates. The portfolio implication is obvious: if further interest rate increases occur, longer maturity high quality bonds will experience significant capital losses. In just the first quarter of 2022, high grade bonds (measured by the Barclays US Aggregate Index) lost 5.9%, the second worst start to a year in history (and hardly what risk-averse bond investors expect). Graph 3 shows a 30 year history of the index’s yield (a proxy for return) and duration (representing risk). Despite the recent increase in yield, the sector’s return potential remains depressed (ultimately bond returns are closely linked to yield) and risk remains elevated, when compared to history.
Graph 3
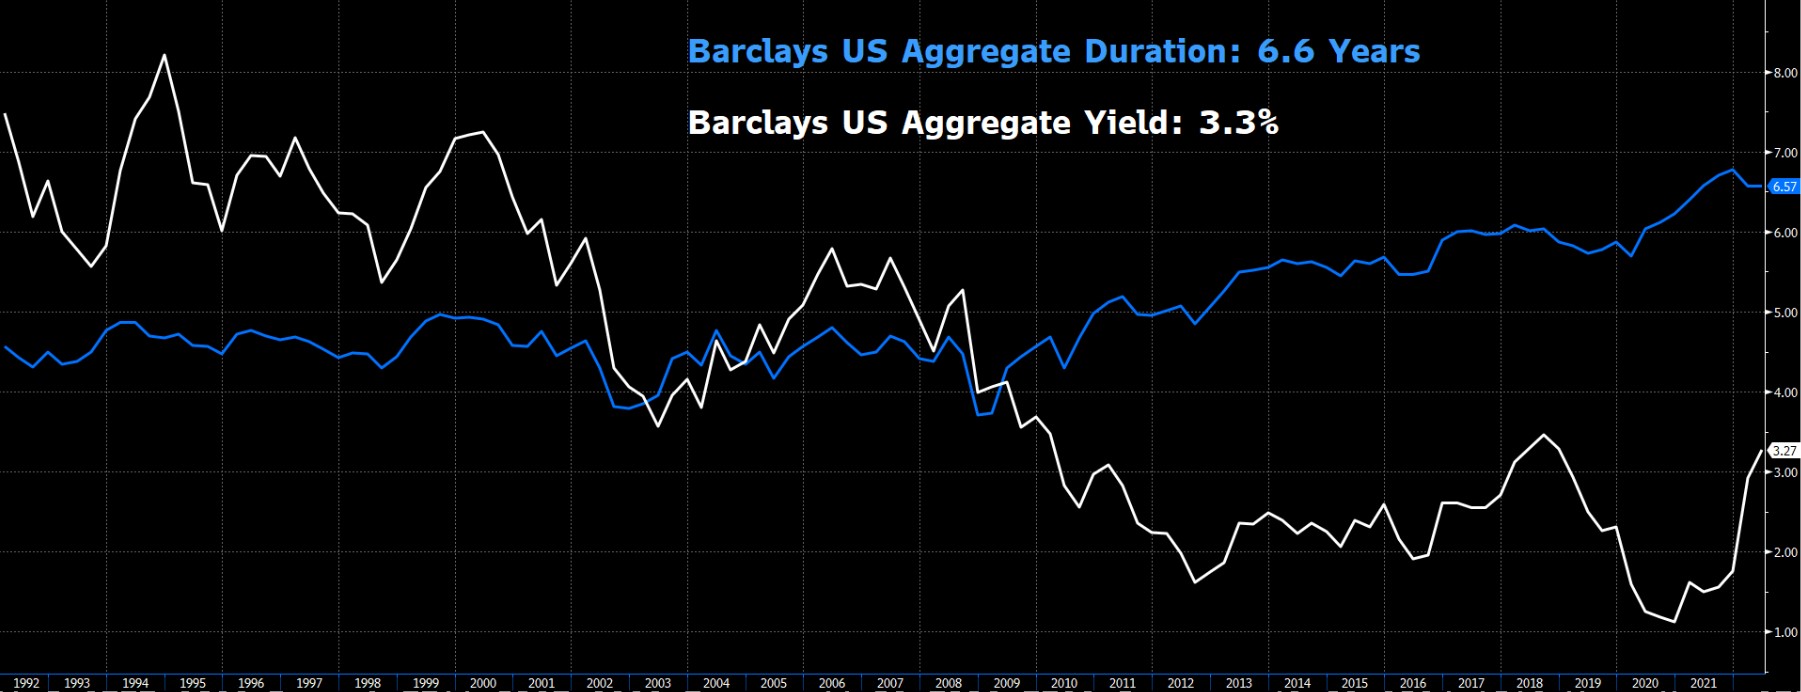
Source: BBG
Graph 4 illustrates the “real” yield on another high-grade bond benchmark – the US Treasury 10 year note. Real yield refers to a bond’s yield minus the prevailing inflation rate, and represents the actual increase or decrease in purchasing power that accrues to the bond’s owner; price inflation constitutes a direct decrease in purchasing power, and if inflation exceeds a bond’s yield, then the bondholder experiences a net loss in purchasing power. As the 60 year graph depicts, the current real yield on the 10 year Treasury note is -6.2%; this is the lowest in history….even lower than the high-inflation periods of the ‘70s and ‘80s.
Graph 4
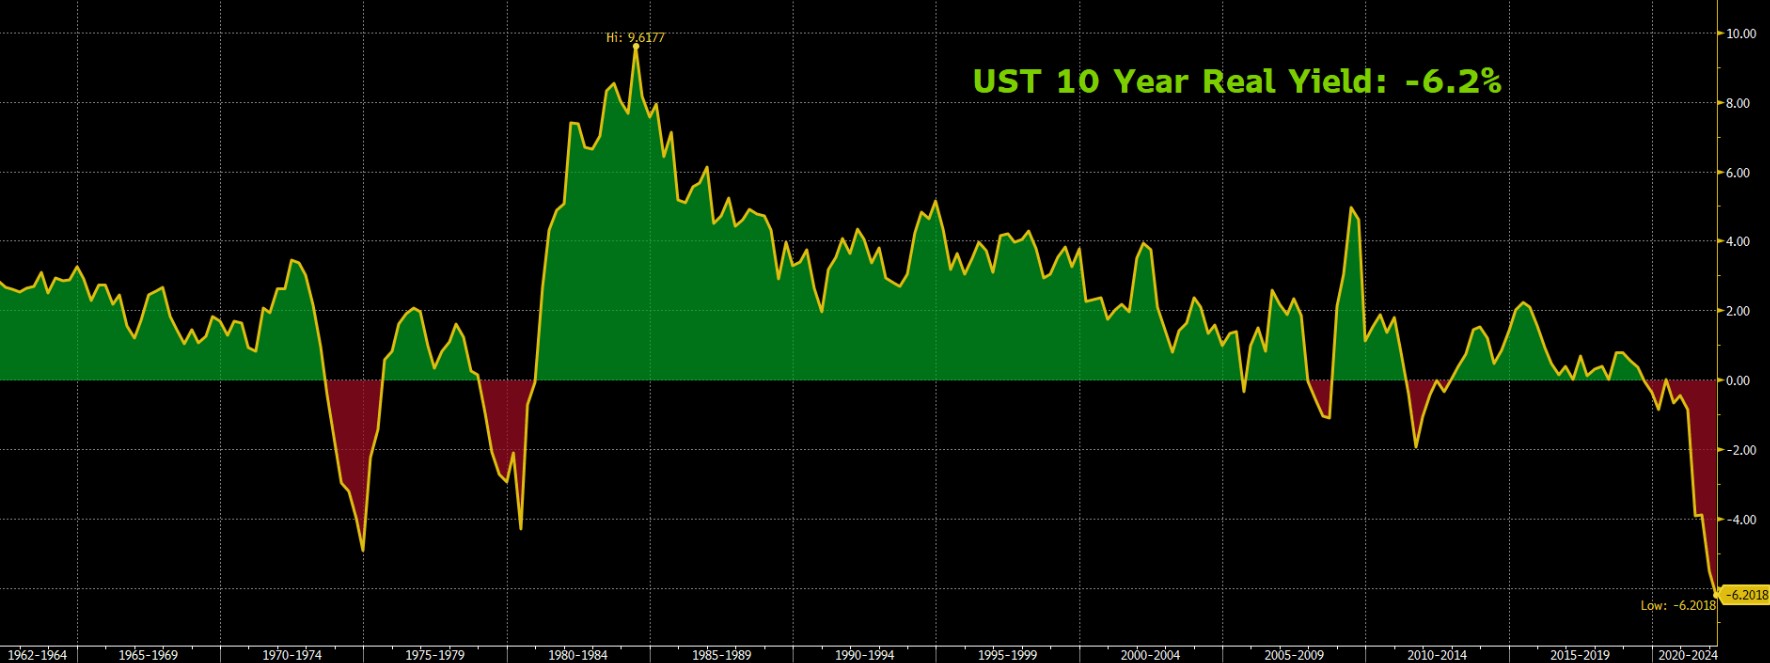
Source: BBG
Portfolio Implications of High Inflation and a Newly Hawkish Fed
First, we should not let the news headlines (the Russia/Ukraine war, recession fears) scare us into cutting our stock exposure too aggressively. There are always risks, and as soon as one fades (COVID shutdowns), another emerges. Stocks tend to climb a “wall of worry”, and often tend to do best when pessimism is highest. We currently have a modest underweight position in stocks because of valuation concerns (and we are skewed toward value rather than growth stocks) but we are hesitant to cut exposure further simply because of inflation fears.
Second, and more importantly, we are being very conservative in our exposure to high-grade bonds. The risk of capital loss currently is quite high, and the yield available is quite low (and the real yield is even lower). To achieve this, we have reduced risk by shortening the duration of our bond holdings. Our bond holdings have a duration far less than that of the Barclays Aggregate index, thereby significantly reducing the risk of capital loss. We view our high-grade bond positions as representing “dry powder” which can be deployed advantageously if stocks and other risky assets experience significant losses.
Finally, we can look for assets that offer low correlations to both stocks and bonds, as well as positive return potential. We have recently made an allocation to a trading strategy that is designed to offer uncorrelated returns, and will continue to look for other such opportunities.
As we often communicate, far more important than tactical portfolio allocation choices is making the right strategic decision of how much risk is appropriate for an individual investor’s situation. Making this decision correctly, periodically reviewing and adjusting it as circumstances change, and sticking with the plan over cycles is how investors will achieve their financial goals.
Thank you for your trust, and please contact an SFA team member with any questions, or to review your strategic financial plan.
The information contained within this letter is strictly for information purposes and should in no way be construed as investment advice or recommendations. Investment recommendations are made only to clients of Santa Fe Advisors, LLC on an individual basis. The views expressed in this document are those of Santa Fe Advisors as of the date of this letter. Our views are subject to change at any time based upon market or other conditions and Santa Fe Advisors has no responsibility to update such views. This material is being furnished on a confidential basis, is not intended for public use or distribution, and is not to be reproduced or distributed to others without the prior consent of Santa Fe Advisors.
 To Top