Market Overview
Markets have exhibited much higher than normal volatility this year, driven by a great deal of geopolitical uncertainty. The start of the war against Iran, launched jointly by the US and Israel without prior notice to NATO or other American allies, delivered positive and negative developments that have whipsawed markets. The US stock market began the year strongly but was quickly put under pressure by the very high valuations of the “Magnificent Seven” and other highly priced growth stocks and by the onset of the war in February which drove oil prices to highs not seen since 2008. The markets have rebounded a bit since the end of the first quarter, with the S&P 500 up 1.4% since April 1, although that index is still down by 3% year-to-date.
However, unlike previous years in which the S&P 500 consistently and monotonously outperformed other major asset classes, this year it is lagging. Specifically, the year-to-date figure of -3% compares unfavorably to the Russell 2500 index of small and medium sized stocks (up 4.1%) and non-US stocks (up 2.3%). We were surprised that gold, which tends to do extremely well in periods of conflict and uncertainty, dropped at the start of the war, but the gold index is still up a strong 9% for the year and a whopping 58% for the past twelve months. Bonds are flat, with the Bloomberg Aggregate Bond Index up a modest 0.2% for the year to date, slightly less than the short 1-3 year index as interest rates have risen slightly.
Chart 1
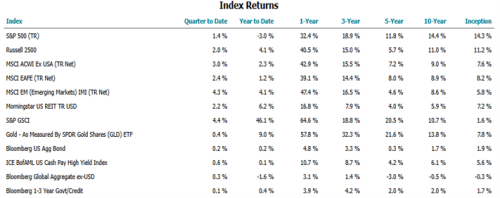
Source: Orion – Data as of April 7, 2026
As we write this, we are in the first days of a fragile cease-fire, which has buoyed today’s markets, but it is difficult to know whether or how long this will last. The uncertainty and volatility, along with the relatively strong performance of certain markets, reinforces our usual advice about taking a long term approach to investing and not reacting to short term events, as well as to maintaining a diversified portfolio. The latter was quite difficult to justify over a period where the S&P 500 outperformed year after year after year, but the wisdom of this approach has been illustrated by this year’s events.
With many of the old rules and guidelines getting discarded, we as investors have to be ready for just about anything. Last year markets sold off in response to new and unprecedented tariff policies announced by the Trump administration. While many of these announcements were alarming, the net results so far have been much more muted than was originally feared. Chart 2 shows that net tariff collections have settled at about 10% of the value of our imports, and the recent Supreme Court ruling could eventually result in about half of those collections being refunded to the businesses who paid them. Once investors realized the difference between headlines and reality, the global stock markets recovered. Of course, this is not the end of the story. Even 10% tariffs are inflationary and will probably affect long-term returns in both stock and bond markets, but our point is that rational behavior tends to emerge after the dust clears.
Chart 2
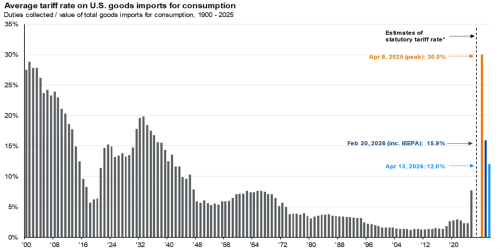
Source: JPM Guide to the Markets – Data as of April 13, 2026
Now that the tariff threat seems to be more or less under control, the new worry rattling the markets is “Operation Epic Fury” and its effects on the global trade in oil, liquified natural gas, and fertilizer.
What should one do?
Run for the exit, buy the dip, or perhaps just stay the course? It’s always been very hard to predict the effects of political and economic events on markets, but it’s even more difficult in these uncertain times, so let’s focus on what we do know.
We know that the economy is growing, albeit at a slow pace. The Bureau of Economic Analysis estimates that GDP growth was 2.2% in 2025 and will likely slow a little in 2026. Job growth is rather anemic, but with little or no growth in the size of the workforce, the unemployment rate has stayed very low. Corporate earnings, on the other hand, tell a substantially different story. After expanding 13% last year, S&P 500 earnings per share are expected to grow 17% in 2026 according to Chart 3. Earnings are certainly not growing because of a booming economy. Many sectors of our economy, such as farming, retail, manufacturing, and construction are actually contracting or growing very slowly. However, corporations by and large have been able to squeeze more revenue out of each employee and grow their earnings through margin expansion. Some of this increased productivity is certainly due to adoption of artificial intelligence, but it’s likely that more of it is simply due to higher efficiency standards. Wage earners are working harder and business owners (and stockholders) are profiting. If earnings do continue growing at high double digit rates, that should bode well for the stock market, since over the long term, earnings growth and stock market growth are highly correlated.
Chart 3
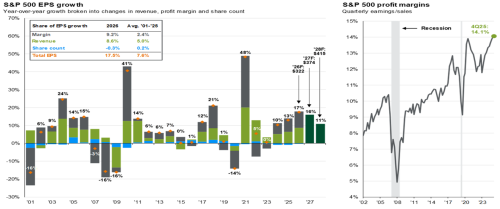
Source: JPM Guide to the Markets – Data as of April 13, 2026
The recent sell-off in equity markets have made stock market valuations somewhat less expensive, but they still remain well above long-term averages. The current forward price/earnings ratio for the S&P 500 is around 20.3x, down from 21.4x at the beginning of the year but still nearly one standard deviation above the 20 year average, Chart 4. So, in other words, a lot of good news is already priced into stocks that make up the S&P 500. This is why we have chosen to allocate significant portions of our portfolios into less expensive markets, such as small and mid-sized companies in the US, and overseas stocks.
Chart 4
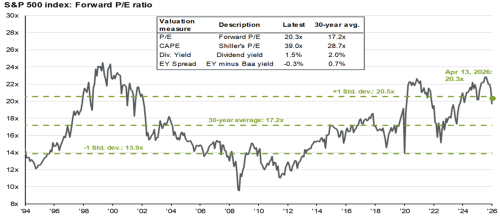
Source: JPM Guide to the Markets – Data as of April 13, 2026
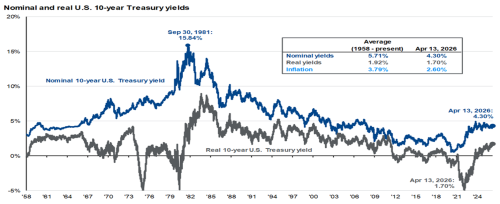
Another way to balance the risk of an expensive stock market is the bond allocation in your portfolio. Thankfully, after several years of negative real yields (gross yield minus inflation) in the US Treasury bond market, investors are finally getting a reasonable yield from their bonds.
Chart 5
Source: JPM Guide to the Markets – Data as of April 13, 2026
Chart 5 above shows the nominal yield on 10-year Treasury bonds (blue line) and the net or real yield after deducting inflation (black line). Since current real yields are very close to the long term average, it suggests that bond prices are probably fairly valued and we can expect reasonable single digit returns going forward in the bond portion of our investments.
Of course, there is much more to the bond world than Treasuries. Corporate bonds, high yield bonds (rated below BBB), municipal bond and international bonds, among others, can add additional yield to your portfolio and diversify your risk away from the US Government, which is running up the debt load higher than it’s been since WWII. The additional yield (or yield spread) over Treasuries that one gets paid for owning investment grade and high yield corporate bonds is currently quite modest relative to long-term averages, but given extremely low default rates in the current environment, we feel these sectors deserve a prominent place in a well balanced portfolio.
Current events can be very distracting and disconcerting. We feel very deeply for the many innocent people caught in the crossfire of world events, but we will continue looking through the headlines and focusing on the fundamentals of the markets and the economy. We thank you for continuing to trust our investment team and our process to manage your investments.
The information contained within this letter is strictly for information purposes and should in no way be construed as investment advice or recommendations. Investment recommendations are made only to clients of Santa Fe Advisors, LLC on an individual basis. The views expressed in this document are those of Santa Fe Advisors as of the date of this letter. Our views are subject to change at any time based upon market or other conditions and Santa Fe Advisors has no responsibility to update such views. This material is being furnished on a confidential basis, is not intended for public use or distribution, and is not to be reproduced or distributed to others without the prior consent of Santa Fe Advisors.
 To Top