I grew up on a street with big old oak trees. Those trees had been there forever, at least as a 6 year old understands the concept of forever. So it was a shock when, in a violent Maryland summer thunderstorm, one of those old oaks fell, taking out a good part of our neighbor’s house. It turns out that the old tree had been rotting from the inside for many years, but nobody knew it until suddenly it came crashing down.
I’m beginning to wonder whether the US Treasury market is like that old oak…massive, unchanging, seemingly eternal…but beset by internal rot and vulnerable to suddenly crashing down and causing massive destruction.
Recently, Congress passed the so-called Big Beautiful Bill (“BBB”). We will not attempt to parse all of the various policy initiatives and tradeoffs that are contained in this legislation; today’s focus is on the effect that this bill is likely to have on US federal debt and the implications thereof.
Chart 1 below shows the level of US debt relative to GDP for the past sixty years. It began to rise significantly in 2008 during the Great Financial Crisis and currently stands at about 120% of GDP.
Chart 1

Source: Federal Reserve Bank of St. Louis, FRED
Chart 2 shows the level of US debt relative to other major economies. You can see that the US currently is slightly below Italy and Greece and well below Japan, but ahead of all other developed economies.
Chart 2

Source: Bloomberg, FactSet, JPM, WEO
Credible estimates of the impact of the Big Beautiful Bill are that it will increase the deficit by about $3.5 trillion over the next 10 years, or about 15% of GDP. By itself, that would take US debt up to about 136%, or just ahead of Italy. But that pales in comparison to the structural deficit already built into the US budget, which shows no signs of abating. In fact, the US government is currently running a deficit of about 6% of GDP annually, which means that without any changes, the debt would increase by 60% over the next 10 years. The 15% added by the BBB may seem small in comparison…one might call it “icing on the cake” if the cake itself were not so unappealing.
One forecast has the debt level rising to roughly $54 billion by 2034, which is a 60% increase from the roughly $33 billion of debt the US had in 2023. That would put US debt levels at 235% of GDP, which is roughly the current Japanese level.
What’s the Big Deal?
After all, Japan’s debt level has been well above 200% for years, and their economy doesn’t seem to have collapsed. Well, part of the answer lies in Chart 3 below.
Chart 3
The 2025 federal budget, USD trillions

Source: CBO, JPM
You can see that the net interest paid by the government was just under $1 trillion. But what happens if (when) the total debt rises by 60%? Using the current 10-year Treasury rate of 4.35%, that annual interest cost would be about $2.35 trillion…one-third of today’s $7 trillion budget, which would represent by far the single largest expense of the government. And if interest rates rise to higher levels…say 6 or 7%…then the cost of interest alone could represent half of the total budget. That means that, absent tax increases or cuts in defense and entitlement programs, the deficit is bound to increase.
In the past 25 years, there has been a relentless drive toward lowering US tax rates. All of that is well and good…lower taxes and smaller government are generally associated with higher growth and a business-friendly environment. But it is also important to be able to pay your bills.
What are the consequences of massive US deficits and budgetary shortfalls? Nobody knows for sure, but let’s talk about how this might play out. Let’s say that in 5-10 years, the government is running a budget deficit of $3 trillion per year. Where does the US come up with $3 trillion per year?
Borrow It
This would cause the supply of US debt on the market to increase dramatically (because remember, we need to refinance all the existing debt as it becomes due AND add $3 trillion a year in new borrowing). The current size of the US Treasury market is about $26 trillion, so this would add roughly 10% of new supply into that market every year and, as noted above, double the size of outstanding debt over 10 years.
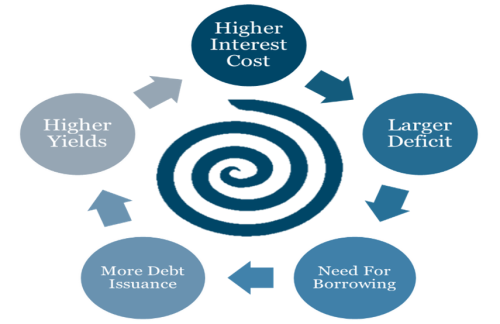
While the US Treasury market is huge and liquid (in fact, the largest single market in the world), it is still subject to the basic economic laws of supply and demand. And those laws, if I remember my Economics 101 correctly, say that when you increase the supply of something, then the price must drop unless demand changes. For a while, the market may be willing to absorb the increased supply. But no market is infinite and eventually there will be more Treasuries for sale than the market wishes to buy. When that happens, the Treasury will have to make them more attractive, in the form of higher yield (lower prices), to attract buyers in the quantity that it needs. And this will start a vicious cycle, as shown in Chart 4. It ultimately ends in a spiral where the cost of debt rises to an unsustainable level and the US is forced to restructure or default on its bonds.
Chart 4
Create It
During the Great Financial Crisis, the Federal Reserve greatly expanded its balance sheet by buying large quantities of long-duration Treasury bonds to drive up prices and drive down yields…the so-called “quantitative easing”. Since the Fed is the regulator of the nation’s money supply, it was able to do this by simply creating money. And it could do that again. Basically, the Federal Reserve would print money and buy the Treasury debt.
What could go wrong? Not many people are alive today who remember the hyperinflation experienced by the German Weimar Republic in 1921-23. But that was a situation caused by a government which could not pay its bills and therefore printed money to solve the problem. As a result, the mark lost more and more of its value as the money supply increased, with ludicrous results. A loaf of bread, which cost 1 mark in 1919, cost 100 marks in 1922 and 200 billion marks (!) in 1923, at the height of hyperinflation.
I’m not suggesting that the US would experience inflation on that scale. However, as with bonds, when you dramatically increase the supply of something, you decrease its value. The current US money supply is about $19-22 trillion, depending on which measure you use, so if the Fed were financing $3 trillion of debt annually, that would be a pretty meaningful increase.
What happens if dollars become less valuable? Inflation is the clearest measure of a devaluing currency, where it takes more and more money to buy the same basket of goods. But beyond domestic inflation, we would also see a significant drop in the value of the US dollar measured against commodities – oil and gold both being primarily denominated in dollars – and against foreign currencies.
Consider the case of the British pound sterling, which was worth over $4.00 per pound (and briefly nearly $7) for most of the period from the American Revolution until World War II. It then gradually dropped, consistent with the declining fortunes of the British Empire, crossed the $2 mark in 1981, and fell below $1.50 in 2016. The same thing could happen with the dollar.
Maybe all of those guys trying to sell me bitcoins have the right idea after all?
Inflate It Away
When you owe a massive amount of fixed rate debt, the easiest way to get “rid” of it is to allow inflation on a large scale. The rule of 72 tells us that if inflation is running at 8%, the value of the debt will be cut in half in 9 years. So it is in the interest of the government to let inflation ramp up as much as possible…this cuts the real value of the debt significantly and allows the US to repay its debt with much cheaper dollars.
The Japanese Paradox
Before talking about the likely consequences of this situation, it would be disingenuous not to acknowledge the staggering level of Japanese government debt (well over 200%…nearly double the level of the next highest developed economy). This has largely been a result of Japan’s aging population and very high costs for their social security program, which they have chosen to fund through borrowings rather than draw down their social security reserves.
Despite that high level of debt, Japan has had very low interest rates (managed by their central bank) and relatively low levels of inflation…not at all what would be predicted. Why? Because Japan has also had a stagnant economy for most of the past 30 years, driven by poor demographics and an aging population. But if the answer to the problem of managing very high debt levels is to allow your economy to stagnate, that doesn’t seem like a very good outcome either.
The Consequences of Out of Control Debt
As described above, a steady stream of large and increasing US government deficits and the corresponding need to issue more and more Treasury bonds are likely to result in higher interest rates, higher inflation, and a weaker US dollar. And the implications of THAT, in investment terms, are pretty clear. In the future, dollar denominated bonds are likely to generate poor, possibly negative, returns. Since all US interest rates are based off the Treasury rates, this is likely to affect not only government debt but also corporate debt, both investment grade and high yield.
If the dollar declines, that would also boost the returns of non-US securities (both equities and fixed income) relative to the US. Chart 5 below shows the relative performance of US and international markets over 33 years. Until the Great Financial Crisis, there were cycles of 6-7 years of outperformance by the US, interspersed with usually briefer but sometimes quite significant outperformance by non-US equities. We are now into the 13th year in which the US has outperformed …unprecedented in the modern era. That’s been driven by a lot of reasonable and understandable factors, most clearly the better performance of the US economy compared to Europe and Japan. But nothing lasts forever, and the issues related to US debt may well be the factor that ends this very long period of outperformance.
Chart 5

Source: FactSet, MSCI, Standard & Poor’s, JPM
How to Manage these Risks for Our Clients?
If the Japanese model comes into play, we will have a period of prolonged economic weakness in which stocks will stagnate and interest rates will remain low despite high government borrowing demand. This seems to me to be highly unlikely but cannot be totally discounted.
If the “normal” economic model prevails, then we will enter a world characterized by high US interest rates, high inflation, and a weaker dollar. In that case, equities, real estate, and commodities will serve as a good inflation hedge and bonds will be disfavored. In a period of dollar weakness, non-US equities (and bonds) are likely to outperform those of the US.
Santa Fe Advisors has long maintained a significant position in non-US equities. Because of the consistent outperformance of the US, this has not in general been a strategy that has added to returns, although it has dampened volatility from time to time. But we maintain our conviction that diversification is likely to produce better risk-adjusted returns with lower volatility over long periods of time. And we may be entering a period where owning non-US stocks is a positive contributor to returns.
Regarding fixed income, we are likely to remain cautious, keep the duration of our portfolios short, and make use of funds that are opportunistic, or that specialize in non-US fixed income. That is the best way to produce positive returns in a rising rate environment, especially if accompanied by dollar weakness.
This commentary is a deeper dive into risks that we are monitoring on behalf of our clients. Aspects of these risks have been discussed over the years at Santa Fe Advisors and the situation, being fluid, will continue to evolve over time. Rest assured that we will continue to monitor and adjust portfolios to manage these risks to the best of our ability.
The information contained within this letter is strictly for information purposes and should in no way be construed as investment advice or recommendations. Investment recommendations are made only to clients of Santa Fe Advisors, LLC on an individual basis. The views expressed in this document are those of Santa Fe Advisors as of the date of this letter. Our views are subject to change at any time based upon market or other conditions and Santa Fe Advisors has no responsibility to update such views. This material is being furnished on a confidential basis, is not intended for public use or distribution, and is not to be reproduced or distributed to others without the prior consent of Santa Fe Advisors.
 To Top