Before the mid 1970s, very few US investors bought non-US securities. They were exotic and difficult to research and hard to buy. But after the passage of the Employees Retirement Income Security Act (ERISA) in 1974, there was increased pressure on the part of pension fund sponsors and managers (who, at the time, represented by far the largest pools of investment capital in the US) to provide stronger and more diversified investment returns.
Led by J. P. Morgan, then one of the largest and most sophisticated US investment managers, there was a gradual push to encourage US pension funds to invest in non-US equities, using the argument that while non-US equities had similar returns, the correlation with US equities was low. As a result, adding non-US equities to the asset mix should have provided similar long term returns with considerably lower volatility.
All of that worked out fine for a while. Non-US equities performed pretty much as expected; there were periods when they did much better than their US counterparts and periods where they did considerably worse, but the countercyclical nature of these movements provided the desired diversification and correlation benefits. That pattern continued more or less through the Great Financial Crisis of 2008.
Chart 1 shows the cycles of outperformance and underperformance of non-US equities versus the US for periods dating back to 1992. The chart is constructed on a rolling three year basis so it shows three year rather than one year performance. As a result, the times when the purple line is rising represents relative outperformance by international equity and the times when it is falling shows relative underperformance.
Chart 1
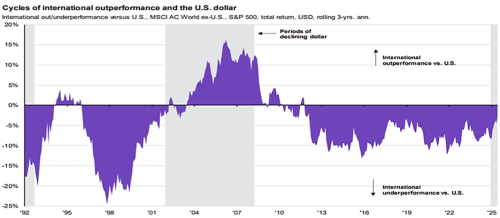
Source: JPM Guide to the Markets – Data as of September 30, 2025
From 1992 to 2008, there were two periods when US equities outperformed (most strongly in 1996 to 1998 as a result of the US dot-com bubble) and one period where non-US equities outperformed (roughly 2000 to 2008). From 1994 to 1996 performance was close to equal.
However, you can see that since 2010, and especially since 2012, US equities have consistently outperformed the rest of the world on a rolling basis. The level of the outperformance has fluctuated but there has never been a three year period since 2013 during which non-US equities outperformed.
All of that led many people to question why they should invest in non-US equities at all. Why buy an asset class that consistently underperforms? And it’s a perfectly reasonable question based on the last 13 years of history.
But nothing lasts forever in the investment world. And so we must ask, is it finally time for non-US equities to outperform more consistently?
The effect of currency movements
Appreciation or depreciation of the dollar vs. foreign currencies has a major impact on the relative returns of US vs. non-US securities. Let’s take a look at how this works. Assume that the Euro is trading at 1.20 to the dollar. If we buy €1000 worth of, say, French equities, that will cost us $1,200. If the Euro then appreciates to 1.30 against the dollar, our securities are now worth $1,300, even though the underlying securities haven’t changed in value. Conversely, if the Euro depreciates to 1.10, the value of our holding goes down…again despite the fact that there was no change in the actual value of the securities as measured in Euros.
Chart 2 shows trends in the value of the dollar against a basket of foreign currencies going all the way back to 1970. This chart shows that currency movements tend to occur over multi-year cycles. For example, the dollar declined for 10 years, appreciated for 5, declined for 7, appreciated for 10, etc. Most relevant to our recent experience, the dollar appreciated for 14 years from 2008 to 2022, before it started to decline.
Chart 2
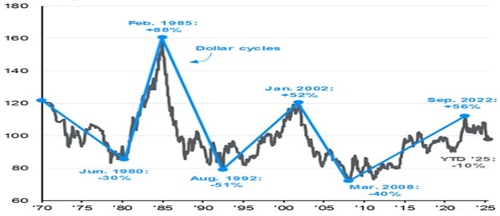
Source: JPM Guide to the Markets – Data as of September 30, 2025
If history is any guide, the decline in the dollar that started in 2022 could last at least five or six years, if not longer, and therefore we might have another three or four years of dollar weakness. This is especially true if the Trump Administration succeeds in obtaining the influence that it seeks over the Federal Reserve, which would likely result in lower interest rates and contribute to a weakening of the dollar.
If this dollar decline occurs – no matter what the reason — it will represent a tailwind for international stock returns. It’s important to note that, as we saw in Chart 1, by far the strongest period for non-US equity investing corresponded with the last major period of dollar weakness.
Relative valuations
Currency movements are important, because they provide a tailwind (or, of course, a headwind) to the returns that are generated by local-market changes in value. But a positive currency effect won’t help much if the underlying fundamentals are not favorable. That would be like buying clothes that you don’t particularly like just because they’re on sale – no bargain at the end of the day.
Chart 3 shows the relative valuations of stocks in the US and four other major regions: Japan, the Eurozone, emerging markets, and China, as of August 31, 2025.
Chart 3
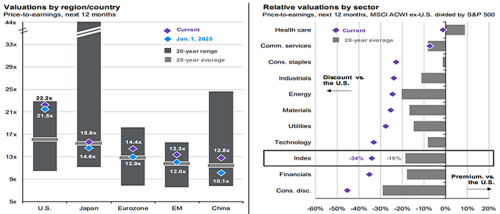
Source: JPM Guide to the Markets – Data as of August 31, 2025
On the left hand side, we can see that the US market is selling at 22.2 times forward earnings, which is near the highest level experienced in the past 20 years and well above its 20 year average of about 16x. In contrast, non-US equities are selling at levels which are only slightly above their 20 year average.
The fact that non-US equities are selling at a discount to the US is not news and therefore not actionable. Rather, this is par for the course. You can see from the horizontal bars, for example, that the US has averaged about a 16x multiple over the last 20 years, while the Eurozone has averaged about 13x, or roughly a 20% discount. The average multiples for emerging markets and China are lower, and that for Japan is closer to that of the US. So the fact that there’s a discount is in line with history. It’s the magnitude of the discount that’s important. The “index” bar on the right side of Chart 3 indicates that the current discount is 34%, which is almost twice the long term average of 19%.
The right side of Chart 3 breaks out US versus non-US valuations by sector. In most cases, the amount of the valuation discount is much higher than it has been over the past 20 years. In some cases, this discount may be justified and appropriate.
For example, big US tech companies like Nvidia, Google, and Microsoft have few rivals in the developed world, and it may be appropriate for them to sell at above-average multiples compared to their non-US competitors. But that is much less true for companies operating in more prosaic industries such as financials, utilities, or consumer staples, all of which are selling at significantly larger discounts than usual.
All of this is no doubt a function of very high valuations for US equities and less-high ones for the rest of the world. And we are very cognizant of the fact that high valuations can stay high for a long time…so the fact that the US market is expensive is not, by itself, a reason to make asset allocation decisions. However, the fact that non-US equities are selling at a higher than usual discount to US stocks (which are, inarguably, about as expensive as they have ever been), combined with the possibility of an extended period of dollar weakness, points to a possible reversal of the long trend of US outperformance.
Conclusion
The investment philosophy of Santa Fe Advisors has always been to steer our investments toward areas that we believe are relatively undervalued, and away from areas that we believe are relatively overvalued. And given the relative valuations of the US vs the rest of the world, when combined with what could well be a period of sustained dollar weakness, there appears to be a plausible case for non-US stocks finally reversing their 13 year history of underperformance. This has been the case so far this year.
Our portfolios have always had a healthy dose of non-US equities. A full 44% of our equity exposure in our moderate portfolios is in the form of developed and emerging markets equities, which is a much higher level than most US managers currently maintain. We are not anticipating any increase in this level, but we are comfortable with this exposure and are optimistic that market movements will result in positive results for our clients.
The information contained within this letter is strictly for information purposes and should in no way be construed as investment advice or recommendations. Investment recommendations are made only to clients of Santa Fe Advisors, LLC on an individual basis. The views expressed in this document are those of Santa Fe Advisors as of the date of this letter. Our views are subject to change at any time based upon market or other conditions and Santa Fe Advisors has no responsibility to update such views. This material is being furnished on a confidential basis, is not intended for public use or distribution, and is not to be reproduced or distributed to others without the prior consent of Santa Fe Advisors.
 To Top